


Design and simulation software for photovoltaic systems
The industry standard for PV system design with 3D visualization and detailed shading analysis
PV*SOL premium
PV*SOL premium is the professional software for 3D design and simulation of photovoltaic systems – including precise shading analysis. For more than 25 years, engineers, planners, and installers worldwide have relied on this industry standard to optimally design PV systems, reliably calculate yields, and create bankable reports. Whether for residential homes or commercial rooftops, for full or surplus feed-in, or in combination with battery storage, electric vehicles, and heat pumps – PV*SOL premium models every system configuration realistically and flexibly.
The unique 3D visualization is the highlight of PV*SOL premium. You can visualize all common types of systems in 3D, whether roof-integrated or roof-mounted, whether on small angled roofs, large industrial halls or open spaces - with up to 7,500 mounted modules or up to 10,000 roof-parallel modules - and calculate the shading based on 3D objects. With the realistic shading from surrounding objects, you can achieve the highest reliability for your yield forecast.
All other design types from PV*SOL are of course also available in PV*SOL premium. Whether calculating self-consumption, designing battery storage or integrating electric vehicles - PV*SOL premium lets you implement any customer requirement in no time. You can also automatically generate fully customizable circuit diagrams, including safety components.
Our extensive product database includes over 30,000 PV modules, 9,000 inverters, 16,000 battery systems and many other products such as electric vehicles and performance optimizers. It is updated regularly by the product manufacturers themselves, so you can always work with the latest data.
Current feed-in tariffs are available in our database for economic efficiency calculations. Simply add your system costs to receive a detailed financial analysis of the system over 20 years. Finally, create compelling presentations and high-quality, fully customizable project reports for your customers at the click of a button - ready to send as a PDF.
PV*SOL premium is available in German 🇩🇪, English 🇬🇧, Spanish 🇪🇸, French 🇫🇷, Italian 🇮🇹, Polish 🇵🇱, Czech 🇨🇿, Portuguese 🇵🇹 and Turkish 🇹🇷. And with project reports available in 24 languages, language barriers are a thing of the past.
Our technical support team and our help pages offer you assistance with your questions. In our forum you can address more complex questions to our team and other PV*SOL premium users.
Would you like to try out whether PV*SOL premium fits your design process? Download the free trial version now!
Product highlights
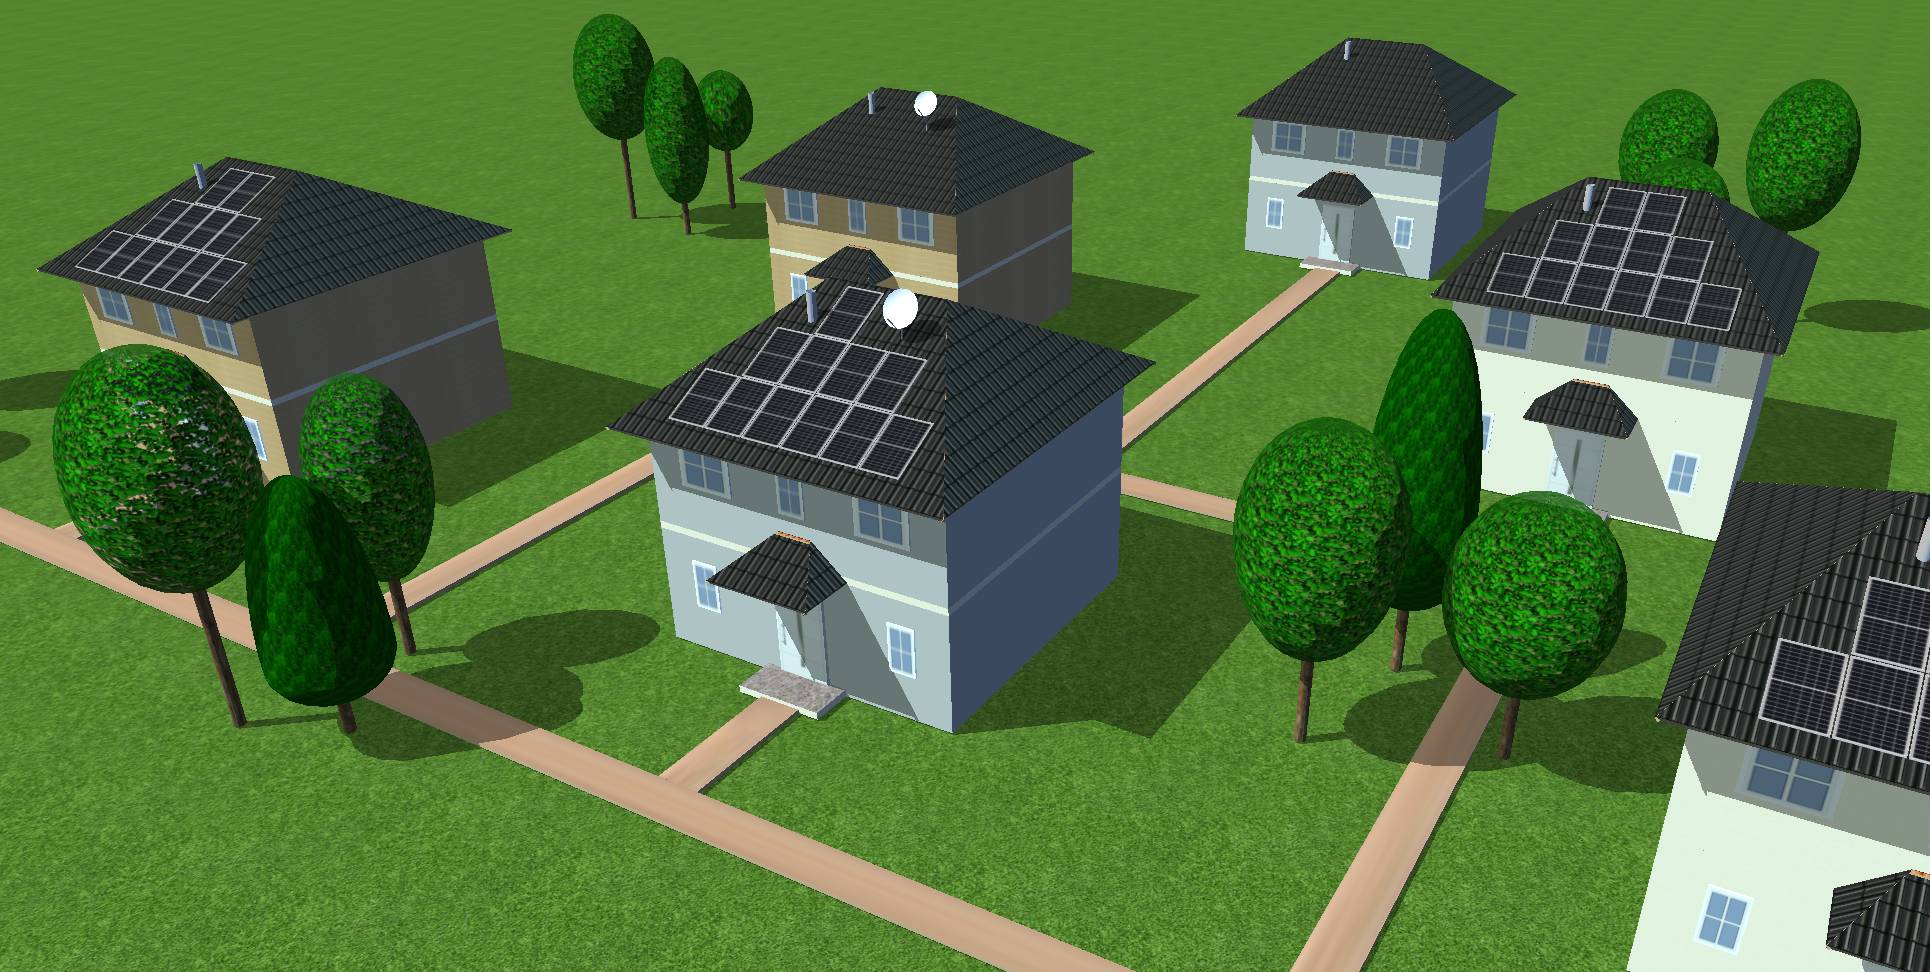
Detailed 3D shading analysis
A three-dimensional representation of surrounding objects is extremely important for determining the reduction in yield due to shading. With PV*SOL premium, you can visualize all roof-integrated and mounted systems - even in open spaces - with up to 7,500 mounted modules or up to 10,000 roof-parallel modules in 3D and calculate the shading based on 3D objects.

Extrude buildings in 3D
Buildings and objects can be created quickly and easily using floor plans, cadastral maps and map screenshots. First the contours are traced, then the building can be extruded by entering the height (any type of building with a pitched or flat roof). In addition, high-resolution orthophotos and elevation data are available via the Google Solar API, and 3D building models for Germany are available via Rexplorer. This makes the PV design in 3D even faster and more accurate.
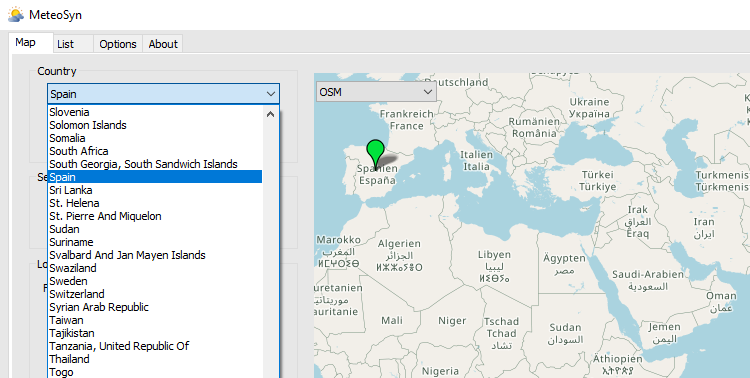
Global climate data available
PV*SOL premium provides you with high-quality TMY data sets for every km² in Germany (own procedure based on DWD data) and for any location worldwide with Meteonorm 9 (data period 2001-2020). In addition, PVGIS, Solcast and SolarAnywhere are available as providers. You can use the interactive map to conveniently select the climate data. Own measurement data can be imported via files in DWD, Meteonorm or WBV format.
More program details

Import of 3D models
3D models of different file formats can be imported to enter object data. This adds another important tool to the existing option of reading floor plans, cadastral maps and screenshots from web-based satellite maps (e.g. Google Earth) directly into the 3D visualization.

Module assignment in 3D view
The roof areas are covered with the maximum possible number of modules automatically, or manually by tracing the areas to be covered by PV. If required, PV*SOL premium can show you the annual radiation reduction (direct and diffuse radiation) for every point of the PV area and for each module. Thanks to interfaces to planning tools like K2 Base (K2 systems) and PV-Configurator (Renusol), systems no longer have to be planned twice.

Polymorphic interconnection in combination with optimizers
Flexibility has been significantly increased when interconnecting the modules that are automatically placed on an object. The new option of polystring interconnection means that completely different strings can be connected in parallel or in series to an MPP tracker. Even different modules in one string, e.g. defective modules that are no longer available, can be replaced with similar ones.

Optimization of the module interconnection
You decide whether you want to connect several module areas to one inverter or choose a separate inverter for each module area, or combine both. The current status of the system check is displayed in the configuration window at all times. The automatic interconnection has been fundamentally improved; in addition, interconnections can be suggested for SolarEdge products.

Current online databases
In our extensive product databases you can currently find data records of over 30,000 PV modules, 8,500 inverters, 12,500 battery systems and many other products such as electric vehicles and performance optimizers, which are updated by the manufacturers. With our online databases, you can easily make your own products available to others.

Detailed project report
Create comprehensive project reports with simulation results and technical details in 24 languages and export them as Word or PDF documents. You can add your company logo to the report and specify which content should be displayed. A visually appealing customer presentation for quotations and customer consultations is also available.

Grid-connected systems with battery storage
Design your own battery storage system by selecting the batteries and defining the battery inverter and charging strategy. Alternatively, you can load battery systems from leading manufacturers. Thermal systems can also be flexibly connected to both AC- and DC-coupled battery storage systems.

Electric vehicles
Select one or more electric vehicles that are simulated in combination with the photovoltaic system. By entering the daily mileage and the downtimes, PV*SOL calculates how much PV energy can be used to charge the electric vehicles.

Summary of results
The detailed results overview contains representations of the simulation results, the results of cost-effectiveness and a detailed tabular energy balance with all the gains and losses that occur. Carpetplots immediately provide you with an annual overview of individual results.
Circuit diagram
PV*SOL supports your system design with an automatically generated, freely configurable circuit diagram. Both the string cable losses and the AC and DC cable losses per inverter can be determined. Numerous safety devices such as fuses, switch disconnectors and surge protection can be easily added.
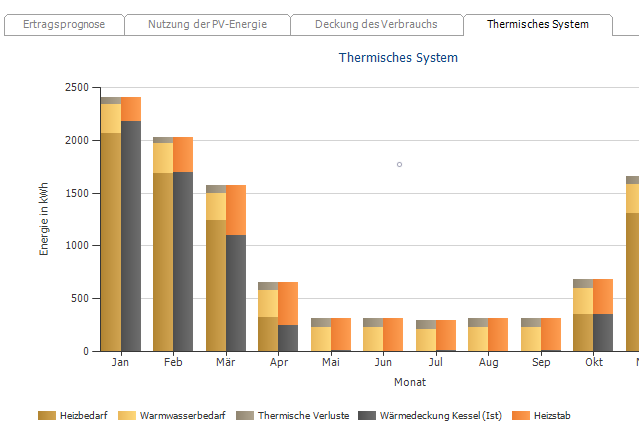
Thermal System
Use your solar energy to support the boiler in the thermal system as heating supply using a heating rod or a simplified model of a air-water heatpump.

Other features
Choose which models you want to use for diffuse radiation and radiation on the inclined surface. The U-I and U-P characteristics for each time step can be produced when required. Exchange your user ID to share self-created products within your company.
Licensing and pricing
Contact
If you have any questions or need advice, call us on +49 (0) 30 588 439 0 or write an e-mail to sales@valentin-software.com.
We are happy to help you.
PV*SOL premium
Named user license (1 year)
Dynamic simulation program including 3D visualization and detailed shading analysis for photovoltaic systems with appliances, battery systems and electric vehicles.
845,00 EUR
plus VAT
System requirements and release notes
System requirements
- Internet connection
- Processor: Intel i3, AMD Ryzen 3 or higher
- RAM: 4 GB
- Hard disk space: 2 GB
- Resolution display: at least 1.280 x 768 pixels
- Operating system: Windows 10 (64 bit, latest service pack required), Windows 11 (64 bit)
- Graphics: DirectX compatible (at least Version 9.0c), 2 GB, OpenGL
- Others: Microsoft .Net Framework 4.8
You can download our free trial version and test whether PV*SOL premium can be run on your computer!
Release Notes
The following new features and changes are included:
- 3D Planning:
- Increased usable RAM.
- The RAM indicator turns red only when it exceeds 1,500 MB.
- The maximum allowed number of modules is now 15,000 for roof-mounted systems and 10,000 for ground-mounted systems.
- Map Tool:
- Rexplorer: The radius of the circle used to select 3D models can be adjusted. The maximum size remains 100 m.
- Google Solar API: Coverage layer updated.
- Economic Efficiency:
- Tariffs with capacity prices can now be defined.
- Importing of dynamic tariffs is now supported.
- Follow-up investments can now be taken into account.
- Energy Management for Battery Systems expanded:
- Delayed battery charging can now be configured.
- The battery can now be used for peak shaving.
- When using dynamic tariffs, battery charging and discharging can be configured based on predefined electricity prices.
- Consumers can now also be added to favorites and selected via a quick selection menu.
- The annual total consumption of load profiles can now be edited with a single click. There is no longer any need to open the “Load Profiles” dialog.
- Circuit Diagram:
- Circuit symbols can now be added for DC intermediate coupled battery systems.
- A surplus consumer can now be displayed with its power rating.
- Improved circuit diagram generation for large-scale projects.
- Revised arrangement of circuit symbols.
- Databases:
- New example products for battery systems and batteries (LiFePO).
- In the "Databases" dialog, product types in the combo box are now sorted alphabetically.
- When importing load profiles, the system now checks whether the maximum file size is exceeded.
- The maximum file size for imported load profiles has been increased to 1024 MB.
- The SolarEdge inverter WR SE20K-EU-APAC/AUS has been added.
- MeteoSyn:
- Improved correction of PVGIS datasets.
- The detail dialog for climate datasets now includes information on data quality.
- New example projects are now available.
- The notification regarding the 60% power limitation in Germany is now also displayed when total power-clipping is defined.
- In the diagram editor, the four-data-series limit when using minute-based values has been removed.
- Improved button highlighting behavior when navigating dialogs using the keyboard.
- Page navigation has been revised.
The following bugs have been fixed:
- The settings "Calculate yield losses due to shading" and "Record characteristic curves for modules" were not saved in the project file (*.pvprj).
- In the configuration check on the inverter page, incorrect symbols were sometimes displayed at the top level.
- Occasional issues when clicking a page navigation button.
- Database dialog:
- In some languages, sorting by "Favorites" and "Suitable/Not Suitable" did not work correctly.
- The existing sorting order was not retained when switching companies.
- Circuit Diagram/Cables:
- Crash on the cabling page when a DC-coupled battery system was selected after 3D planning with multiple inverters, followed by an autosave, and then another element was selected in the tree view.
- For different power optimizers, the number (2) was displayed twice in the diagram.
- When loading the “Cable” page in "Detailed" mode, "xxx cable losses" was initially displayed.
- Crash when displaying tooltips in the configuration dialog of the 3D planning if the dialog had already been closed.
- Occasional crashes during the simulation of very large 3D projects with only a few but large module areas, many inverters with identical configurations, and low levels of shading.
- The "Edit Loan" dialog could not be canceled.
- The coordinates of the SAP climate data record for "North East England" have been corrected.
The following new features and changes are included:
- New map providers for planning with map sections for Poland and the Czech Republic.
- New map providers for planning for the German states of Baden-Württemberg, Hesse and Mecklenburg-Western Pomerania.
- 3D:
- The “Determine Relative Orientation” dialog for mounting systems with east/west orientation is now pre-filled with more appropriate values.
The following bugs have been fixed:
- When updating feed-in tariffs while loading a project, the validity (“Valid from”) of the rates was discarded.
- Crash in the consumption dialog.
- 3D:
- In some cases, values from the “Determine Relative Orientation” dialog were not carried over to the “Edit Mounting System” dialog.
- When exiting the “Determine Relative Orientation” dialog, angles for “Orientation Relative to Reference Edge” greater than 180° could occur.
- When reassigning PV modules in the string configuration - for example, by changing the string direction - the string diagram was not updated.
- MeteoSyn:
- It was not possible to generate climate data for a new location from measurement data in the form of monthly values.
- Solcast:
- It was not possible to register new users.
- It was not possible to use existing accounts if the user ID was no longer known (due to a move or similar).
- URLs for NREL Meteosat have been updated (it is now NLR).
The following new features and changes are included:
- A message is displayed if a surplus consumption has been defined but only one from-grid tariff has been selected.
- An example project with Rexplorer API planning has been added.
- The “Report a Problem with the Rexplorer Model” dialog has been revised.
- The state (open, collapsed) of the group boxes in the 3D map tool is now saved.
- If the program fails to start, the system now checks whether there are any special characters in the installation path.
The following bugs have been fixed:
- Crash after deleting a load profile from measured values whose name had just been changed.
- Crash in the tree view of the load profile dialog.
- The number of cables in the circuit diagram was sometimes displayed incorrectly.
- Options dialog: The checkbox for NEC temperature calculation was not visible.
- Crash when displaying plans if they were transferred twice from 3D.
- 3D:
- An attic could not be defined for 3D models.
- When using Rexplorer API, a reference edge could not be selected when defining a mounting system.
- When the default edge was selected, the correct orientation was not shown on the info button.
- Error messages related to the Rexplorer API have been revised.
The following bugs have been fixed:
- No circuit diagram was generated when special characters were used.
- Rexplorer data were not imported into the 3D planning if data already existed and the “New Project” option was then selected from within the 3D environment.
Features and bug fixes in PV*SOL premium 2026 R5
The following new features and changes are included:
- System planning using automatically generated 3D building models from LiDAR scans of the Rexplorer API (available only for locations in Germany).
- New map providers for planning with map sections for Spain and France.
- Updated TMY climate data from SolarAnywhere.
- Configuration rules for the SolarEdge S500B W, S650B W, and S650A power optimizers have been integrated.
- New load profiles:
- BDEW load profiles H25, G25 and L25
- Elexon UK load profiles (Class 1 to Class 8)
- Catapult UK load profiles
- Load profiles based on measured values can be copied.
- Options menu with a new layout.
The following bugs have been fixed:
- Time controlled charging/discharging for DC battery systems spanning periods beyond midnight (00:00) did not work.
- Error when simulating DC charge controllers.
- Partial crashes occurred when using PVGIS climate datasets in combination with multiple module areas.
- The energy yield for GEG was not updated after changing the degradation.
- Global radiation and the diffuse fraction were not displayed in the characteristic curve diagram.
- Error when importing data (NaN) in the economic analysis.
- When considering taxes, a depreciation period of 0 years could be entered.
The following new features and changes are included:
- When using the planning feature with the Google Solar API, there is now greater coverage in Latin America.
- If no power clipping is set at the feed-in point, it is no longer displayed in the results table.
- Improved import of *.pan files regarding the incident angle modifier and low-light behavior.
- When using an electric vehicle, discharging to cover consumption can be disabled.
- Revised arrangement of the elements in the schematic legend.
The following bugs have been fixed:
- Battery discharge from DC storage systems into the grid during nighttime hours is now correctly displayed on the results page.
- When combining a heat pump and an inverter with or without DC-coupled battery systems, grid feed-in was sometimes too high.
- The program crashed when switching to the page Financial Analysis if multiple consumption tariffs were present and the system was then switched to full grid feed-in.
- If the directory for the ConsumptionDB did not exist when the program was started, the program would not launch. The program now attempts to create the directory. If this fails, an error message appears and the program does not start.
- Exporting the parts list did not work.
- Results per module area: PV generator energy, system efficiency, and specific annual yield were sometimes zero after loading a project file.
- Circuit symbol templates could no longer be sorted by “Name.”
- Changing the options of the circuit diagram was not possible.
- Partially crashes when a project with existing results was loaded, the number of tariffs was changed, and the results page was opened.
- Electric Vehicles database dialog: Discharge power was in the wrong place.
- Not all information was displayed in the circuit diagram in the project report.
- The page orientation of the circuit diagram was not saved.
The following bugs have been fixed:
- No new manual configurations could be made in the 3D planning.
The following new features and changes are included:
- In the circuit diagram, circuit symbols can now also be inserted in front of AC battery systems and electric vehicles (only if the vehicle does not have its own from-grid tariff).
- In the consumption dialog, the load profiles from measured values are now displayed in groups.
- When exporting plans, the type of plan is now appended to the file name.
The following bugs have been fixed:
- When configuring multiple module areas, no more module areas could be assigned from the second inverter onwards.
- Crash when loading projects from program version 2025 with solar peak law that were not simulated.
- Partial crashes on the welcome page when the program was closed.
- Crash when loading projects with battery systems or electric vehicles if there was more than one group and results were already available.
- Problems with the load profile ID if there was only one from-grid tariff left in the tariff list.
- Partial crashes in the dialog for selecting load profiles.
- Correction of the display of the discharge power of electric vehicles (factor 1000).
- A payback period of “1 year and 12 months” is now displayed as “2 years”.
- Crash in short presentation when there were multiple battery system groups with the same battery system product.
- Crash when the field for the name of an “Additional heat source -> Other heat source” was left blank in thermal systems.
- In off-grid projects, the battery system was not displayed correctly in the circuit diagram.
- Crash on the project report page when there were errors (e.g., a bitmap that was too large) in the circuit diagram.
- Error when calculating savings if electric vehicles were used to cover consumption.
- Crash in “New Project” when multiple battery system groups were used but the first group was not selected.
- Problems displaying the design bar for very high power ratings and consumption.
The following new features and changes are included:
- New system type: “Grid-connected PV system with electrical appliances, thermal systems and battery systems”.
- Multiple from-grid tariffs can now be selected and freely assigned to different consumers.
- New compact project report with the most important simulation results.
- New load profiles for air conditioning systems, working from home and retiree households.
- Updated climate data based on Meteonorm 9 (2001–2020).
- All result graphics can be added to the project report.
- Project reports are now also available in Lithuanian.
- Project data and results can be exported to a JSON file.
- 3D:
- Acceleration of shading simulation and shadow frequency calculation.
- The OpenStreetMap provider has been removed from the map tool.
- The profitability calculation dialog has been redesigned.
- When importing consumer load profiles with a leap year, the correct number of values is now also output.
- For time-controlled charging and discharging of battery systems, time periods extending beyond midnight can now also be entered.
- When exporting the results to a CSV file, the formatting of the exported numbers has been standardized and is now without scientific notation.
- With the introduction of the thermal systems plus battery system, it is no longer possible to select the “PV-optimized” heat pump operating mode.
- Diagrams of the characteristic curves can no longer be added to the project report because this would make the project file too large.
- It is currently not possible to generate climate data from your own monthly values.
- The combination of time-controlled charging and DC generator-coupled battery systems is now prevented.
- The license management client has been updated (improved stability).
The following bugs have been fixed:
- 3D:
- Some plans that were no longer valid were not deleted.
- In some cases, existing 3D models were duplicated when reopening the 3D visualization. Removing the duplicates caused a crash.
- Crashes when loading projects with a large number of extruded objects.
- Crashes when extruding polygons.
- Incorrect shadow after importing and moving or rotating objects.
- Some texts in the options dialog were not displayed correctly.
- Artifacts when displaying the shade frequency distribution.
- When opening the 3D visualization, the message “Silhouettes have been corrected” was displayed multiple times.
- In the economic efficiency results, one year was missing from the cash flow table if the assessment period was longer than the remuneration period including solar peak compensation.
- In some cases, the payback period was given as more than 100 years if it exceeded the observation period.
- When opening the options dialog, the time step of the simulation was sometimes changed.
- In some cases, the simulation (yield reduction due to shading) did not start if settings in the options were changed after a simulation was aborted.
- Balance error in the simulation of time-controlled charging and DC-coupled battery systems.
- In some cases, the simulation results were not displayed correctly after loading a project with solar peak compensation.
- In some cases, it was no longer possible to load project files after updating the online database.
- In some cases, the open-circuit voltage was too high after loading the project report several times.
- Incorrect translations.
Contact

Sales
For product inquiries or questions regarding your order, quote, or invoice, please get in touch with our sales team. You can place your order either by e-mail or via our shop.
E-mail: sales@valentin-software.com
Telephone: +49 (0)30 588 439 0
Office hours:
Mon – Thu, 9:00 – 16:00 hrs
Fri, 9:00 – 13:00 hrs

Technical support
Do you have any questions about installation, registration, project-related topics, or our online databases? Our technical support team is here to help:
E-mail: hotline@valentin-software.com
Telephone: +49 (0)30 588 439 0
Office hours:
Mon – Thu, 9:00 – 12:00 hrs and 13:00 – 15:00 hrs
Fri, 9:00 – 12:00 hrs
Visit our Forum and our PV*SOL help pages